|
Color
Assessment Cabinets
Color
Proof Station
D65 Light
Color
measuring instruments
Glossmeters
LED11ET8 G3 940
Haze meter
Hardness
tester
Thickness
gauges
UV Integrator
Surface
Roughness tester
Surface
Thermometer
Gaussmeters
EMF
Meter
Range finder
Lux meters
More>>>
|
DTV Color Rendition Test Chart
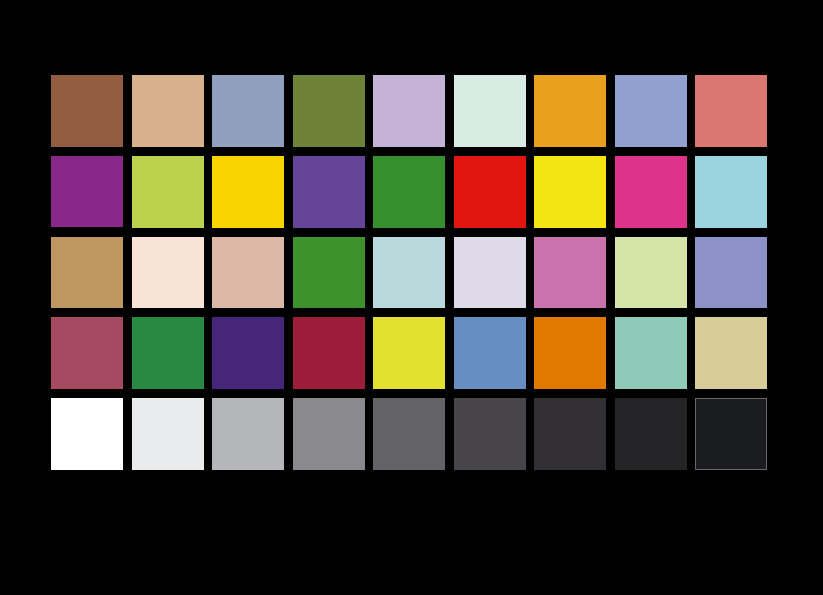
The DTV Color Rendition Test Chart is disigned and used to evaluate the
color rendition of HDTV cameras. The chart consists of 36 color patches
and a 9-step gray scale. In addition to the primary and secondary
colors the test chart contains mainly the colors, which are critical in
reproduction, e.g. dark and light skin tones, foliage, blue sky,
orange, violet and others.
The
chart consists of 36 color patches and 9-step gray scale. Besides the
primary and secondary colors (blue, green, red, yellow, purple and
cyan) the test chart contains mainly colors, which are critical in
reproduction, e.g. dark and light skin tones, foliage, blue sky,
orange, violet and others.
The
colorimetric reports of the 36 colors are shown on the following page.
The
9-step gray scale is graduated as follows:
| Step |
Density |
Transmission
in % |
| 1 |
0.00 |
100 |
| |
|
|
| 2 |
0.06 |
88 |
| |
|
|
| 3 |
0.20 |
63 |
| |
|
|
| 4 |
0.36 |
44 |
| |
|
|
| 5 |
0.55 |
28 |
| |
|
|
| 6 |
0.81 |
16 |
| |
|
|
| 7 |
1.15 |
7 |
| |
|
|
| 8 |
1.65 |
2 |
| |
|
|
| 9 |
>
3.00 |
0 |
| |
|
|
The density is based on the 1st step of
the gray scale.
Date
Some
of the filter foils used are not fade less, especially when exposed to
sunlight (ultra violet light). We therefore recommend to store the
chart in the folder or case when not in use. We also recommend and
offer a recalibration of the chart after 3 years of regular use.
Colorimetric
data – transparency standard illuminant D65
| No. |
Color |
X |
Y |
Z |
U´ |
V` |
X |
Y |
Z |
CB |
CR |
| 1 |
Dark
skin |
0,126 |
0,116 |
0,060 |
0,250 |
0,510 |
0,420 |
0,390 |
68,000 |
-16,400 |
18,000 |
| 2 |
Light
skin |
0,438 |
0,401 |
0,301 |
0,240 |
0,490 |
0,380 |
0,350 |
136,100 |
-14,400 |
26,700 |
| 3 |
Blue
sky |
0,175 |
0,198 |
0,312 |
0,170 |
0,440 |
0,260 |
0,290 |
93,400 |
13,600 |
-17,700 |
| 4 |
Foliage |
0,072 |
0,123 |
0,020 |
0,150 |
0,560 |
0,340 |
0,580 |
66,800 |
-38,300 |
-23,200 |
| 5 |
Blue
flower |
0,352 |
0,334 |
0,565 |
0,200 |
0,430 |
0,280 |
0,270 |
124,900 |
20,400 |
1,800 |
| 6 |
Bluish
green |
0,307 |
0,419 |
0,438 |
0,150 |
0,480 |
0,260 |
0,360 |
137,100 |
-0,140 |
-40,100 |
| 7 |
Orange |
0,410 |
0,337 |
0,046 |
0,290 |
0,540 |
0,520 |
0,420 |
116,100 |
-62,500 |
50,900 |
| 8 |
Purplish
blue |
0,180 |
0,188 |
0,550 |
0,150 |
0,360 |
0,200 |
0,200 |
84,000 |
43,400 |
-41,600 |
| 9 |
Moderate
red |
0,292 |
0,210 |
0,134 |
0,310 |
0,490 |
0,460 |
0,320 |
88,000 |
-10,100 |
49,300 |
| 10 |
Purple |
0,121 |
0,075 |
0,378 |
0,200 |
0,280 |
0,210 |
0,130 |
46,900 |
49,100 |
8,100 |
| 11 |
Yellow
green |
0,458 |
0,615 |
0,261 |
0,170 |
0,530 |
0,340 |
0,460 |
169,000 |
-44,400 |
-19,500 |
| 12 |
Orange
yellow |
0,538 |
0,485 |
0,084 |
0,270 |
0,540 |
0,490 |
0,440 |
144,400 |
-68,900 |
45,200 |
| 13 |
blue
flower |
0,099 |
0,048 |
0,550 |
0,160 |
0,180 |
0,140 |
0,070 |
18,400 |
81,400 |
-29,400 |
| 14 |
Green |
0,103 |
0,224 |
0,050 |
0,110 |
0,560 |
0,270 |
0,590 |
81,300 |
-38,800 |
-74,900 |
| 15 |
Red |
0,316 |
0,160 |
0,003 |
0,460 |
0,530 |
0,660 |
0,330 |
35,500 |
-25,700 |
102,500 |
| 16 |
Yellow |
0,508 |
0,581 |
0,033 |
0,220 |
0,560 |
0,450 |
0,520 |
157,200 |
-116,900 |
20,300 |
| 17 |
Magenta |
0,429 |
0,222 |
0,560 |
0,320 |
0,370 |
0,350 |
0,180 |
69,100 |
52,900 |
80,100 |
| 18 |
Cyan |
0,481 |
0,586 |
0,940 |
0,160 |
0,440 |
0,240 |
0,290 |
163,000 |
24,800 |
-46,100 |
| 19 |
|
0,253 |
0,246 |
0,140 |
0,230 |
0,510 |
0,400 |
0,380 |
104,900 |
-20,400 |
18,100 |
| 20 |
|
0,631 |
0,600 |
0,498 |
0,230 |
0,490 |
0,360 |
0,350 |
168,200 |
-13,200 |
24,000 |
| 21 |
|
0,348 |
0,330 |
0,244 |
0,230 |
0,490 |
0,380 |
0,360 |
123,500 |
-14,400 |
19,900 |
| 22 |
|
0,132 |
0,301 |
0,070 |
0,110 |
0,560 |
0,260 |
0,590 |
90,200 |
-39,200 |
-103,400 |
| 23 |
|
0,348 |
0,438 |
0,553 |
0,160 |
0,460 |
0,260 |
0,330 |
141,600 |
8,400 |
-34,000 |
| 24 |
|
0,512 |
0,515 |
0,783 |
0,190 |
0,440 |
0,280 |
0,280 |
156,500 |
18,600 |
-3,900 |
| 25 |
|
0,334 |
0,208 |
0,020 |
0,380 |
0,530 |
0,590 |
0,370 |
75,700 |
-43,100 |
74,200 |
| 26 |
|
0,401 |
0,550 |
0,438 |
0,160 |
0,500 |
0,290 |
0,400 |
159,200 |
-14,500 |
-35,700 |
| 27 |
|
0,158 |
0,151 |
0,563 |
0,150 |
0,330 |
0,180 |
0,170 |
70,600 |
52,400 |
-45,600 |
| 28 |
|
0,132 |
0,095 |
0,116 |
0,280 |
0,450 |
0,380 |
0,280 |
57,700 |
5,500 |
28,100 |
| 29 |
|
0,215 |
0,415 |
0,454 |
0,110 |
0,480 |
0,200 |
0,380 |
95,100 |
24,100 |
-168,900 |
| 30 |
|
0,150 |
0,078 |
0,611 |
0,190 |
0,220 |
0,180 |
0,090 |
40,300 |
74,200 |
4,000 |
| 31 |
|
0,279 |
0,135 |
0,146 |
0,410 |
0,440 |
0,500 |
0,240 |
34,300 |
24,300 |
90,300 |
| 32 |
|
0,793 |
0,847 |
0,500 |
0,210 |
0,510 |
0,370 |
0,400 |
200,600 |
-34,900 |
13,500 |
| 33 |
|
0,135 |
0,161 |
0,434 |
0,140 |
0,380 |
0,190 |
0,220 |
70,700 |
40,100 |
-62,100 |
| 34 |
|
0,014 |
0,074 |
0,060 |
0,050 |
0,510 |
0,100 |
0,490 |
35,300 |
2,800 |
-84,000 |
| 35 |
|
0,626 |
0,540 |
0,232 |
0,270 |
0,520 |
0,450 |
0,390 |
155,100 |
-37,600 |
47,100 |
| 36 |
|
0,410 |
0,436 |
0,288 |
0,210 |
0,500 |
0,360 |
0,380 |
143,400 |
-21,300 |
8,900 |
All
values calculated from the colorimetric measurement results (CIE-XYZ
values) for the ITU Rec. 709. The brightness is related to the picture
white of patch 37 (=100% transmission).
Color Rendition Chart (X-Rite ColorChecker)
Scan Reference Chart
Universal
Test Target
Critical
Flesh Tones Test Chart
Bar Test Chart(IEC 61146)
White Balacing Test Chart
ISO 12233:2014 Edge SFR(eSFR)Test chart
Color Spilled Coins (Dead Leaves) Test Chart
Gray Scale Test Chart(11 steps)
Streaking Measurement Test Chart
Color Bar Test Chart
Gray scale chart
Grid Test Chart
ISO 12233 Enhanced digital camera resolution chart
Standard SFRplus Chart
SFRplus Chart on Photographic Paper QI-SFR10-P-RM
ITE Grayscale Chart II(Gamma = 1)
Black & White Spilled Coins (Dead Leaves) Test Chart
OECF Test Chart (ISO 14524)
ISO 12233: 2014 (eSFR)Photographic chart
ISO-14524 digital camera contrast chart
ISO-15739 digital camera noise test chart
ISO 12233 Digital still-camera resolution chart
Automotive Test Chart
SFRplus Chart: Inkjet on Paper - 4:1 Contrast Ratio
SFRplus Chart: Inkjet on Paper - 10:1 & 2:1 Contrast Ratio
Distortion Grid Test Chart
HDTV Gray Scale Test Chart
ITE Grayscale Chart I(Gamma = 0.45)
EIA RESOLUTION CHART 1956
Sector Star Test Chart (72 cycles)
Sector Star Test Chart (36 cycles)
HDTV Universal Test Chart
DTV Color Rendition Test Chart
36-Patch Dynamic Range Test Chart
Spectrometer
OHSP-350
OHSP350A Light
Spectrometer
HPL-200
Flicker illuminometer
|
