|
|
|
|
|
|
|
|
|
|
|
|
|
|
|
Bar Test Chart(IEC 61146) 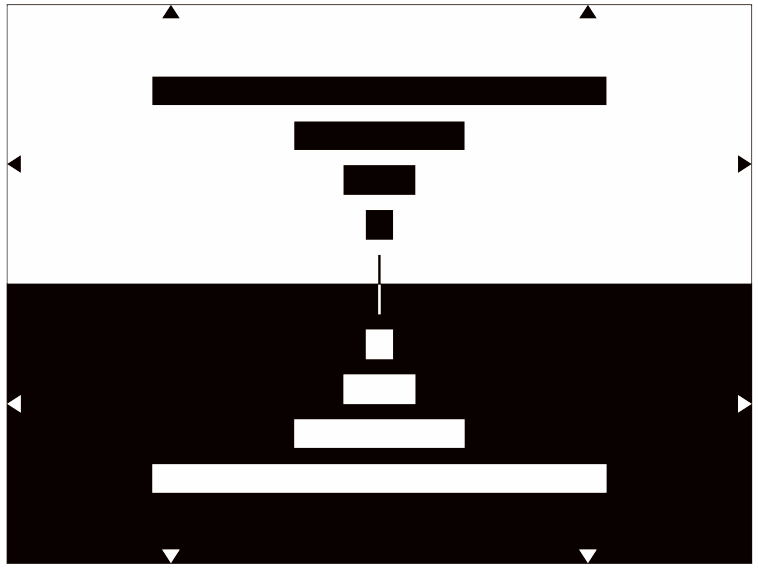 The Bar Test Chart(IEC 61146) is disigned and used to checking the transmission characteristics of TV cameras at intermediate and deep frequencies.In the upper part of the picture 4 black horizontal bars of different length are arranged in a white surrounding. In the upper part of the picture 4 black horizontal bars of different length are arranged in a white surrounding. The lower part is a mirror image to the upper one; however white bars are arranged in a black surrounding. A narrow vertical strip of black and white each are located in the center of the picture. These strips resp. bars generate puls signals of approx. 2 µs, 5 µs, 12 µs and 32 µs. Inadequate transmission characteristics at intermediate and deep frequencies generate streaking effects in scanning line direction. Streaking may also be caused by defective clamping circuits. Long streaking (high error-time-constancy) are clearly visible at the monitor. Short streaking (low error-time-constancy) can be better observed in the oscillogram. For this purpose an oscilloscope with a line selector has to be used and the different bars may be observed one after the other. Also the adjustment of streaking (e.g. compensation of afterglow of flying spot scanners) should be effected with the aid of picture monitor and oscilloscope. The narrow vertical strips in the center of the picture show echo disturbances, as may occur e.g. with defective delay lines in circuits for aperture corrections. The large black and white areas in both parts of the picture are designed to asses shadings, background structure and other errors. For this purpose the test chart may also be used upside down. Color Rendition Chart (X-Rite ColorChecker) Scan Reference Chart Universal Test Target Critical Flesh Tones Test Chart Bar Test Chart(IEC 61146) White Balacing Test Chart ISO 12233:2014 Edge SFR(eSFR)Test chart Color Spilled Coins (Dead Leaves) Test Chart Gray Scale Test Chart(11 steps) Streaking Measurement Test Chart Color Bar Test Chart Gray scale chart Grid Test Chart ISO 12233 Enhanced digital camera resolution chart Standard SFRplus Chart SFRplus Chart on Photographic Paper QI-SFR10-P-RM ITE Grayscale Chart II(Gamma = 1) Black & White Spilled Coins (Dead Leaves) Test Chart OECF Test Chart (ISO 14524) ISO 12233: 2014 (eSFR)Photographic chart ISO-14524 digital camera contrast chart ISO-15739 digital camera noise test chart ISO 12233 Digital still-camera resolution chart Automotive Test Chart SFRplus Chart: Inkjet on Paper - 4:1 Contrast Ratio SFRplus Chart: Inkjet on Paper - 10:1 & 2:1 Contrast Ratio Distortion Grid Test Chart HDTV Gray Scale Test Chart ITE Grayscale Chart I(Gamma = 0.45) EIA RESOLUTION CHART 1956 Sector Star Test Chart (72 cycles) Sector Star Test Chart (36 cycles) HDTV Universal Test Chart DTV Color Rendition Test Chart 36-Patch Dynamic Range Test Chart Spectrometer OHSP-350 OHSP350A Light Spectrometer HPL-200 Flicker illuminometer |
(C) Copyright reserved
©
QQ:461750718
Tel:+86-755-29983363
