|
|
|
|
|
|
|
|
|
|
|
|
|
|
|
ISO 12233:2014 Edge SFR(eSFR)Test chart 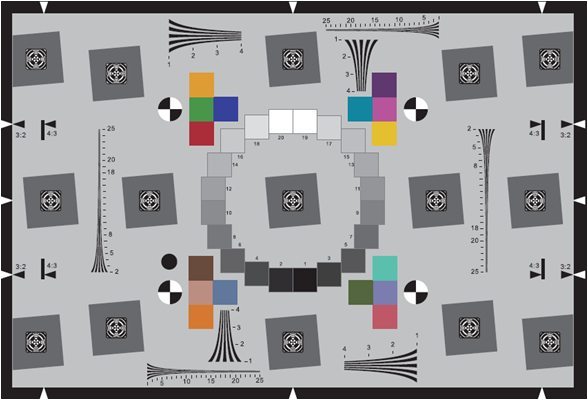 The ISO 12233:2014 Edge SFR(eSFR)Test chart/E-SFR charts are implementations of the Low Contrast Edge SFR (E-SFR) test chart illustrated in Section 6.1 and Annex Cof the ISO Standard Document. The charts come in three versions: Standard: basic, no extra measurement features; Enhanced: extra squares, wedges, and color patterns when printed with technologies that allow color Extended: similar to Enhanced, but with a 16:9 aspect ratio, suitable for HDTV and cinema
Standard 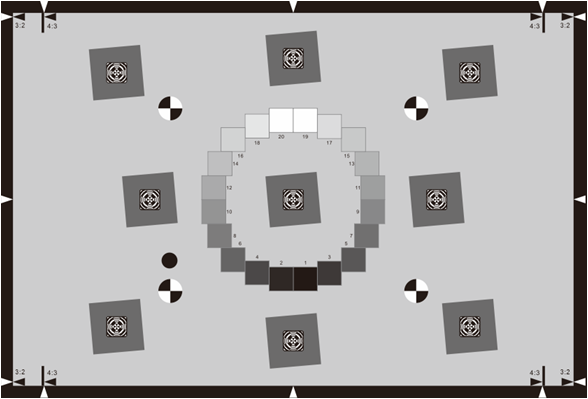 This
chart, which has a 3:2 aspect ratio, is a "no-frills"
implementation of the standard. For most work we recommend the Enhanced
or Extended charts, which have additional edges for measuring
performance near the image boundaries, as well as hyperbolic wedges and
color patches (where the technology allows). These chartsmaintain full
compliance with the standard.
Enhanced The Enhanced ISO 12233:2014 E-SFR chart has all the features of the Standard chart, keeping the 3:2 aspect ratio, with the addition of six added slanted squaresfor measuring performance near the image boundaries and hyperbolic wedges for visual analysis or analysis with the Imatest Wedge module. It also has 16 color patches when produced with technologies that allow color. Since these additions are in regions of the chart not covered by the standard, compliance with the standard is unaffected. The differences between the Imatest charts and the chart illustrated in the standard are listed below. Even with these differences the Imatest chart is in full compliance with the standard.
The differences between the Enhanced and Standard Versions are as follows:
This chart will work with the fully-automated eSFR ISO module. Extanded 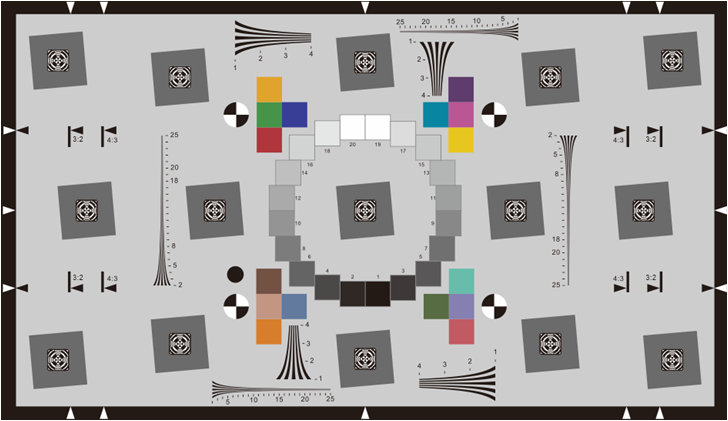 The Extended ISO 12233:2014 E-SFR chart has all the features of the Enhanced chart (six extra squares, wedges, and 16 color patches where possible), but has a16:9 aspect ratio, which makes it suitable for HDTV and cinema measurements (and it also works well with 3:2 aspect ratio DSLRs). It is fully compliant with the standard. This chart will work with the fully-automated eSFR ISO module. Color Rendition Chart (X-Rite ColorChecker) Scan Reference Chart Universal Test Target Critical Flesh Tones Test Chart Bar Test Chart(IEC 61146) White Balacing Test Chart ISO 12233:2014 Edge SFR(eSFR)Test chart Color Spilled Coins (Dead Leaves) Test Chart Gray Scale Test Chart(11 steps) Streaking Measurement Test Chart Color Bar Test Chart Gray scale chart Grid Test Chart ISO 12233 Enhanced digital camera resolution chart Standard SFRplus Chart SFRplus Chart on Photographic Paper QI-SFR10-P-RM ITE Grayscale Chart II(Gamma = 1) Black & White Spilled Coins (Dead Leaves) Test Chart OECF Test Chart (ISO 14524) ISO 12233: 2014 (eSFR)Photographic chart ISO-14524 digital camera contrast chart ISO-15739 digital camera noise test chart ISO 12233 Digital still-camera resolution chart Automotive Test Chart SFRplus Chart: Inkjet on Paper - 4:1 Contrast Ratio SFRplus Chart: Inkjet on Paper - 10:1 & 2:1 Contrast Ratio Distortion Grid Test Chart HDTV Gray Scale Test Chart ITE Grayscale Chart I(Gamma = 0.45) EIA RESOLUTION CHART 1956 Sector Star Test Chart (72 cycles) Sector Star Test Chart (36 cycles) HDTV Universal Test Chart DTV Color Rendition Test Chart 36-Patch Dynamic Range Test Chart Spectrometer OHSP-350 OHSP350A Light Spectrometer HPL-200 Flicker illuminometer |
(C) Copyright reserved
©
QQ:461750718
Tel:+86-755-29983363
