|
|
|
|
|
|
|
|
|
|
|
|
|
|
|
ITE Grayscale Chart II(Gamma = 1) 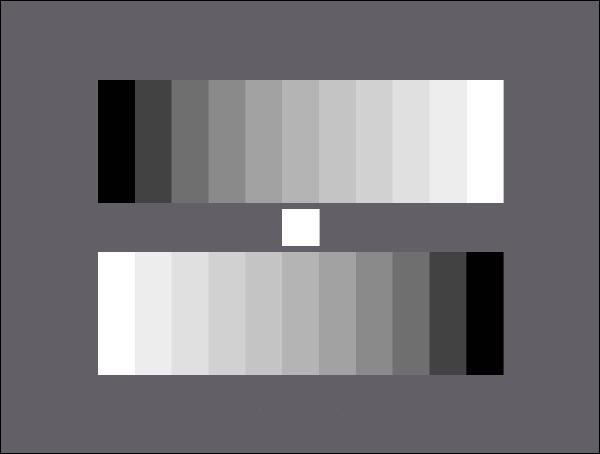 The ITE Grayscale Chart II(Gamma = 1) is disigned and used to evaluate the halftone reproduction of an electronic camera. Two 11-graduated counter current gray scales are arranged on a gray background (D≈0.65), the gray scales being graduated linear. Related to the densities of the gray scales: gamma = 1. The contrast range of the gray scales is 40:1. Properties
The values of the 11-graduated gray scales are the follows:
The density of the white filed between the gray scales is D = 0.05 (reflectance = 89%). ITE Gray scale Chart I(Gamma = 1)
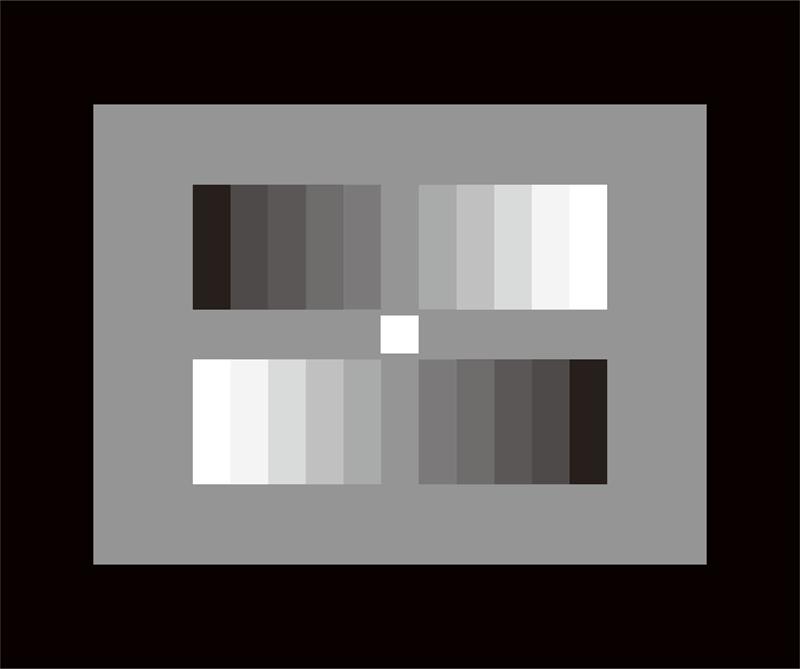
The ITE Gray scale Chart I(Gamma = 1) is disigned and used to evaluate the halftone reproduction of an electronic camera. Two 11-graduated counter current gray scales are arranged on a gray background(D=0.62) . The gray scales being graduated logarithmically (gamma = 0.45).The output signal of an optimal gamma-corrected camera yields two 11-graduated counter current linear step signals. The contrast range of the gray scale is 40:1. The values of the 11-graduated gray scale are as follows:
The density of the white field between the gray scale is D=0.05 (reflectance = 89%). Color Rendition Chart (X-Rite ColorChecker) Scan Reference Chart Universal Test Target Critical Flesh Tones Test Chart Bar Test Chart(IEC 61146) White Balacing Test Chart ISO 12233:2014 Edge SFR(eSFR)Test chart Color Spilled Coins (Dead Leaves) Test Chart Gray Scale Test Chart(11 steps) Streaking Measurement Test Chart Color Bar Test Chart Gray scale chart Grid Test Chart ISO 12233 Enhanced digital camera resolution chart Standard SFRplus Chart SFRplus Chart on Photographic Paper QI-SFR10-P-RM ITE Grayscale Chart II(Gamma = 1) Black & White Spilled Coins (Dead Leaves) Test Chart OECF Test Chart (ISO 14524) ISO 12233: 2014 (eSFR)Photographic chart ISO-14524 digital camera contrast chart ISO-15739 digital camera noise test chart ISO 12233 Digital still-camera resolution chart Automotive Test Chart SFRplus Chart: Inkjet on Paper - 4:1 Contrast Ratio SFRplus Chart: Inkjet on Paper - 10:1 & 2:1 Contrast Ratio Distortion Grid Test Chart HDTV Gray Scale Test Chart ITE Grayscale Chart I(Gamma = 0.45) EIA RESOLUTION CHART 1956 Sector Star Test Chart (72 cycles) Sector Star Test Chart (36 cycles) HDTV Universal Test Chart DTV Color Rendition Test Chart 36-Patch Dynamic Range Test Chart Spectrometer OHSP-350 OHSP350A Light Spectrometer HPL-200 Flicker illuminometer |
(C) Copyright reserved
©
QQ:461750718
Tel:+86-755-29983363
