|
|
|
|
 
|
   
|


Color Assessment Cabinets

Color Proof Station

D65 Light

Color measuring instruments

Glossmeters

LED11ET8 G3 940

Haze meter

Hardness tester

Thickness gauges

UV Integrator

Surface Roughness tester

Surface Thermometer

Gaussmeters

EMF Meter

Range finder

Lux meters

More>>>


Color Spilled Coins (Dead Leaves) Test Chart
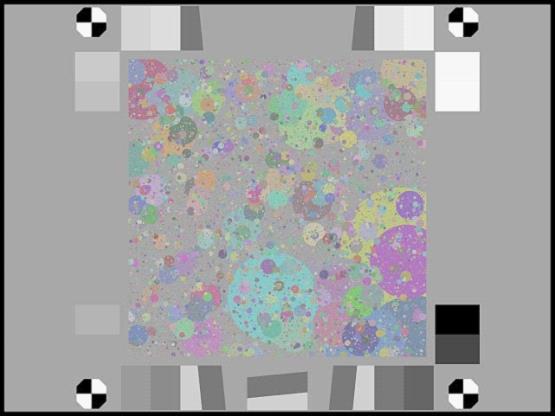

Color Spilled Coins Test Chart

The Color Spilled Coins (Dead Leaves) Test Chart (a variant of the Dead Leaves chart) is designed for measuring texture sharpness has several advantages over older Dead Leaves charts.


Features:

  • The Scattered Coins pattern in the central region is almost perfectly scale-invariant (unlike conventional dead leaves charts), enhancing the accuracy and robustness of MTF measurements so they correlate well with other methods (such as the slanted-edge) for RAW images (which have no nonuniform or nonlinear processing).
  • Maximum contrast range is 3:1, as called for in the CPIQ Phase 3 draft Texture Blur Metric draft specification.
  • It is more uniform, i.e., is more shift-invariant than other Dead Leaves charts.
  • It contains slanted edges (2:1 and 4:1 contrast) for convenient comparisons with the dead leaves pattern.
  • The gray area to the left and right of the dead leaves pattern has the same mean density as the dead leaves pattern, allowing it to be used for effective noise PSD removal using the McElvain et. al. technique.
  • Registration marks and 16 grayscale patches are included. The linear levels used to create the grayscale patches are 0 through 255 in steps of 17 (same as the Siemens Star chart in the draft of the upcoming ISO 12233 standard).


Spilled Coins chart sizes Spilled Coins region Printed region Media size total
Large 12" × 12"
305 mm × 305 mm
22.4" × 16.8"
569 mm × 426 mm
24" × 18"
610 mm × 458 mm
Medium 8" × 8"
203 mm × 203 mm
14.93" × 11.2"
379 mm × 284 mm
16" × 12"
458 mm × 305 mm
Small 6" × 6"
152 mm × 152 mm
11.2" × 8.4"
284 mm × 213 mm
12" × 10"
305 mm × 254 mm
X-Small (High Precision Transmissive) 5.536" × 5.536"
141 mm × 141 mm
9.25" × 7.75"
159 mm × 197 mm
10" × 8"
254 mm × 203 mm


Color Rendition Chart (X-Rite ColorChecker)

Scan Reference Chart

Universal Test Target

Critical Flesh Tones Test Chart

Bar Test Chart(IEC 61146)


White Balacing Test Chart


ISO 12233:2014 Edge SFR(eSFR)Test chart


Color Spilled Coins (Dead Leaves) Test Chart


Gray Scale Test Chart(11 steps)


Streaking Measurement Test Chart


Color Bar Test Chart


Gray scale chart


Grid Test Chart


ISO 12233 Enhanced digital camera resolution chart


Standard SFRplus Chart


SFRplus Chart on Photographic Paper QI-SFR10-P-RM


ITE Grayscale Chart II(Gamma = 1)


Black & White Spilled Coins (Dead Leaves) Test Chart


OECF Test Chart (ISO 14524)


ISO 12233: 2014 (eSFR)Photographic chart


ISO-14524 digital camera contrast chart


ISO-15739 digital camera noise test chart


ISO 12233 Digital still-camera resolution chart


Automotive Test Chart


SFRplus Chart: Inkjet on Paper - 4:1 Contrast Ratio


SFRplus Chart: Inkjet on Paper - 10:1 & 2:1 Contrast Ratio


Distortion Grid Test Chart


HDTV Gray Scale Test Chart


ITE Grayscale Chart I(Gamma = 0.45)


EIA RESOLUTION CHART 1956

Sector Star Test Chart (72 cycles)


Sector Star Test Chart (36 cycles)


HDTV Universal Test Chart


DTV Color Rendition Test Chart


36-Patch Dynamic Range Test Chart


Spectrometer OHSP-350

OHSP350A Light Spectrometer

HPL-200 Flicker illuminometer


(C) Copyright reserved © QQ:461750718 Tel:+86-755-29983363