|
Color
Assessment Cabinets
Color
Proof Station
D65 Light
Color
measuring instruments
Glossmeters
LED11ET8 G3 940
Haze meter
Hardness
tester
Thickness
gauges
UV Integrator
Surface
Roughness tester
Surface
Thermometer
Gaussmeters
EMF
Meter
Range finder
Lux meters
More>>>
|
Color Bar Test Chart
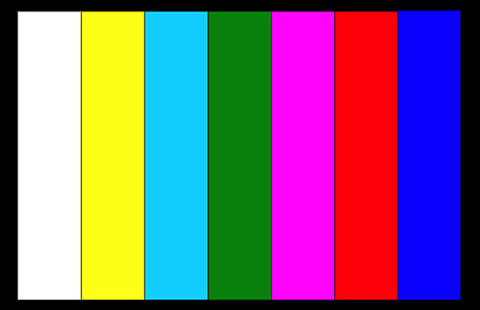
The
Color Bar Test Chart is disigned and used to checking
the color rendition of TV cameras. The picture area is divided into six
color bars showing the three primary colors red, green and blue and the
secondary colors cyan, yellow and purple; in addition there is one bar
of white and black. The succession corresponds to that of an
electronically generated color bar.
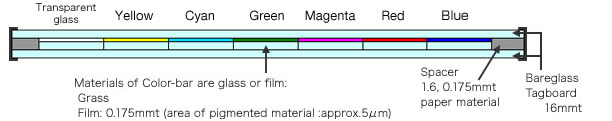
| Color |
Transparent |
Yellow |
Cyan |
Green |
Magenta |
Red |
Blue |
| Density |
0.08~1.0 |
1.4~2.0 |
0.9~1.3 |
1.95~2.35 |
1.1~1.5 |
1.8~3.0 |
0.8~1.2 |
Transparent
Type
| |
Effective
Area |
Outer
Size |
| 4:3 |
245×175 |
320×290 |
| 16:9 |
272×153 |
310×200
|
Color Rendition Chart (X-Rite ColorChecker)
Scan Reference Chart
Universal
Test Target
Critical
Flesh Tones Test Chart
Bar Test Chart(IEC 61146)
White Balacing Test Chart
ISO 12233:2014 Edge SFR(eSFR)Test chart
Color Spilled Coins (Dead Leaves) Test Chart
Gray Scale Test Chart(11 steps)
Streaking Measurement Test Chart
Color Bar Test Chart
Gray scale chart
Grid Test Chart
ISO 12233 Enhanced digital camera resolution chart
Standard SFRplus Chart
SFRplus Chart on Photographic Paper QI-SFR10-P-RM
ITE Grayscale Chart II(Gamma = 1)
Black & White Spilled Coins (Dead Leaves) Test Chart
OECF Test Chart (ISO 14524)
ISO 12233: 2014 (eSFR)Photographic chart
ISO-14524 digital camera contrast chart
ISO-15739 digital camera noise test chart
ISO 12233 Digital still-camera resolution chart
Automotive Test Chart
SFRplus Chart: Inkjet on Paper - 4:1 Contrast Ratio
SFRplus Chart: Inkjet on Paper - 10:1 & 2:1 Contrast Ratio
Distortion Grid Test Chart
HDTV Gray Scale Test Chart
ITE Grayscale Chart I(Gamma = 0.45)
EIA RESOLUTION CHART 1956
Sector Star Test Chart (72 cycles)
Sector Star Test Chart (36 cycles)
HDTV Universal Test Chart
DTV Color Rendition Test Chart
36-Patch Dynamic Range Test Chart
Spectrometer
OHSP-350
OHSP350A Light
Spectrometer
HPL-200
Flicker illuminometer
|
