|
Color
Assessment Cabinets
Color
Proof Station
D65 Light
Color
measuring instruments
Glossmeters
LED11ET8 G3 940
Haze meter
Hardness
tester
Thickness
gauges
UV Integrator
Surface
Roughness tester
Surface
Thermometer
Gaussmeters
EMF
Meter
Range finder
Lux meters
More>>>
|
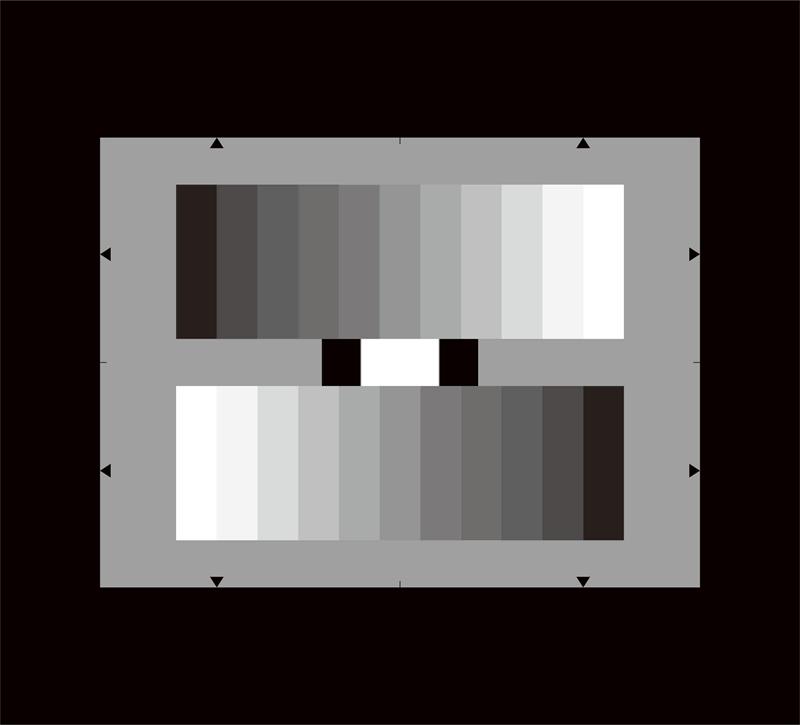
Gray Scale Test Chart(11 steps)
The
Gray Scale Test Chart(11 steps) is disigned and used to evaluate
the halftone reproduction of electronic cameras. Two 11-graduated
counter current gray scales are arranged on a gray background (D=0.75),
the gray scale being graduated logarithmically.
Related to the densities of the gray scales: gamma = 0.45
Related to the reflectance values (brightness): gamma = 2.2 , that being exactly the reciprocal value of gamma = 0.45.
The
output signal of an optimally gamma-corrected camera yield two
11-graduates counter current linear step signals. The contrast range of
the gray scales is 40 : 1.
The values of the 11-graduated gray scale are as follows:
| Step |
Density |
Reflectance in % |
| 1 |
0.05 |
89 |
| 2 |
0.13 |
74 |
| 3 |
0.22 |
60 |
| 4 |
0.32 |
48 |
| 5 |
0.43 |
37 |
| 6 |
0.55 |
28 |
| 7 |
0.69 |
20 |
| 8 |
0.88 |
13 |
| 9 |
1.06 |
8 |
| 10 |
1.31 |
5 |
| 11 |
1.65 |
2 |
The
density values are based on BaSo4 = 0. Two black fields and a
white field are located between the gray scales, the density of the
black filed is D > 2.4 (reflectance < 0.5 %). The density of the
white filed is D = 0.05 (reflectance = 89.9 %).
Color Rendition Chart (X-Rite ColorChecker)
Scan Reference Chart
Universal
Test Target
Critical
Flesh Tones Test Chart
Bar Test Chart(IEC 61146)
White Balacing Test Chart
ISO 12233:2014 Edge SFR(eSFR)Test chart
Color Spilled Coins (Dead Leaves) Test Chart
Gray Scale Test Chart(11 steps)
Streaking Measurement Test Chart
Color Bar Test Chart
Gray scale chart
Grid Test Chart
ISO 12233 Enhanced digital camera resolution chart
Standard SFRplus Chart
SFRplus Chart on Photographic Paper QI-SFR10-P-RM
ITE Grayscale Chart II(Gamma = 1)
Black & White Spilled Coins (Dead Leaves) Test Chart
OECF Test Chart (ISO 14524)
ISO 12233: 2014 (eSFR)Photographic chart
ISO-14524 digital camera contrast chart
ISO-15739 digital camera noise test chart
ISO 12233 Digital still-camera resolution chart
Automotive Test Chart
SFRplus Chart: Inkjet on Paper - 4:1 Contrast Ratio
SFRplus Chart: Inkjet on Paper - 10:1 & 2:1 Contrast Ratio
Distortion Grid Test Chart
HDTV Gray Scale Test Chart
ITE Grayscale Chart I(Gamma = 0.45)
EIA RESOLUTION CHART 1956
Sector Star Test Chart (72 cycles)
Sector Star Test Chart (36 cycles)
HDTV Universal Test Chart
DTV Color Rendition Test Chart
36-Patch Dynamic Range Test Chart
Spectrometer
OHSP-350
OHSP350A Light
Spectrometer
HPL-200
Flicker illuminometer
|
