|
|
|
|
 
|
   
|


Color Assessment Cabinets

Color Proof Station

D65 Light

Color measuring instruments

Glossmeters

LED11ET8 G3 940

Haze meter

Hardness tester

Thickness gauges

UV Integrator

Surface Roughness tester

Surface Thermometer

Gaussmeters

EMF Meter

Range finder

Lux meters

More>>>


Sector Star Test Chart (72 cycles)

Sector Star Test Chart (72 cycles)

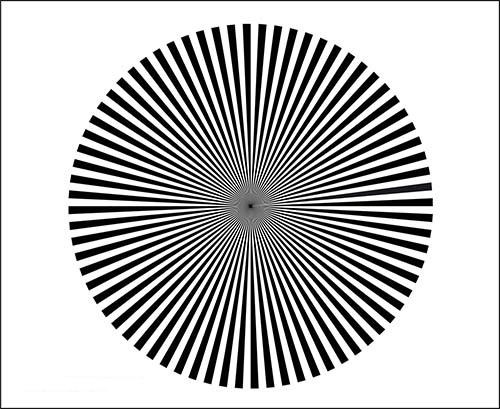
The Sector Star Test Chart (72 cycles) is disigned 

for the adjustment of camera lenses and checking back focal distance. It shows a 72 sector Siemens star on a white background.

The test chart is designed for

  • adjustment of camera lenses
  • checking back focal distance

 
With the aid of a low transmission filter and by means of low level lighting make sure that the camera is not over modulated with the aperture in the open position.

  1. Optical focus: Adjust focus of zoom lens at greatest focal length.
  1. Back focal distance (lens): Adjust focus at shortest focal length by regulating lens mechanically with adjustment screw and optimize alternatively with a).
  1. Back focal distance (pick-up tubes): If focus varies from channel to channel between greatest and shortest focal length, the individual pick-up tubes must be adjusted mechanically in the optical axis.
 
  1. Select white channel. Set optical focus at greatest focal length. With shortest focal length and divergent focus adjust the pick-up tube in W-channel until optimum focus is achieved. If necessary optimize by alternating with optical focus adjustment.
  2. With unchanged optical focus adjustment and shortest focal length adjust the red and blue pick- up tube until optimum focus is achieved. Image focus (focus adjustment) is maintained at all focal lengths (zoom-in) and constant distance from object by means of back focal distance adjustment.


Sector Star Test Chart (36 cycles)


Sector Star Test Chart

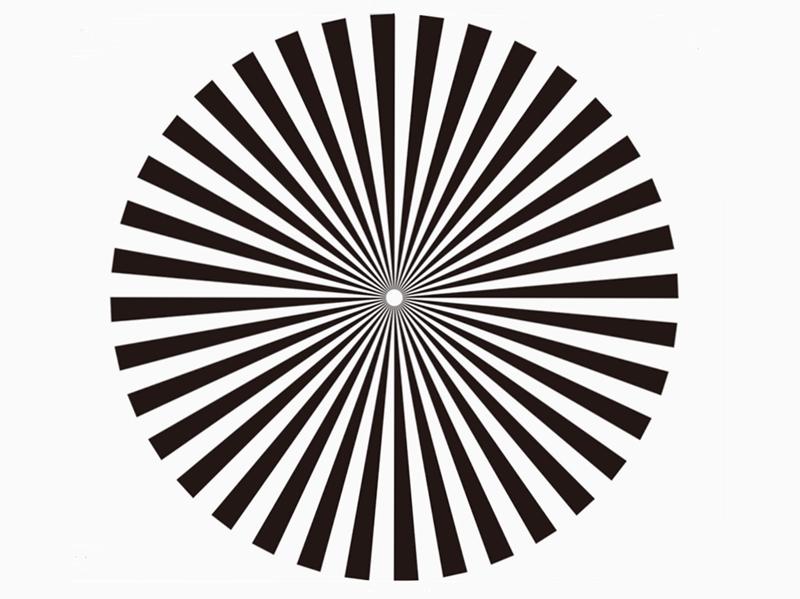
It shows a 36 sector Siemens star on a white background.

With the aid of a low transmission filter and by means of low level lighting make sure that the camera is not over modulated with the aperture in the open position.

a) Optical focus: Adjust focus of zoom lens at greatest focal length.

b) Back focal distance (lens): Adjust focus at shortest focal length by regulating lens mechanically with adjustment screw and optimize alternatively with a).

c) Back focal distance (pick-up tubes): If focus varies from channel to channel between greatest and shortest focal length, the individual pick-up tubes must be adjusted mechanically in the optical axis.
1、Select white channel. Set optical focus at greatest focal length. With shortest focal length and divergent focus adjust the pick-up tube in W-channel until optimum focus is achieved. If necessary optimize by alternating with optical focus adjustment.
2、With unchanged optical focus adjustment and shortest focal length adjust the red and blue pick-up tube until optimum focus is achieved. Image focus (focus adjustment) is maintained at all focal lengths (zoom-in) and constant distance from object by means of back focal distance adjustment.


Color Rendition Chart (X-Rite ColorChecker)

Scan Reference Chart

Universal Test Target

Critical Flesh Tones Test Chart

Bar Test Chart(IEC 61146)


White Balacing Test Chart


ISO 12233:2014 Edge SFR(eSFR)Test chart


Color Spilled Coins (Dead Leaves) Test Chart


Gray Scale Test Chart(11 steps)


Streaking Measurement Test Chart


Color Bar Test Chart


Gray scale chart


Grid Test Chart


ISO 12233 Enhanced digital camera resolution chart


Standard SFRplus Chart


SFRplus Chart on Photographic Paper QI-SFR10-P-RM


ITE Grayscale Chart II(Gamma = 1)


Black & White Spilled Coins (Dead Leaves) Test Chart


OECF Test Chart (ISO 14524)


ISO 12233: 2014 (eSFR)Photographic chart


ISO-14524 digital camera contrast chart


ISO-15739 digital camera noise test chart


ISO 12233 Digital still-camera resolution chart


Automotive Test Chart


SFRplus Chart: Inkjet on Paper - 4:1 Contrast Ratio


SFRplus Chart: Inkjet on Paper - 10:1 & 2:1 Contrast Ratio


Distortion Grid Test Chart


HDTV Gray Scale Test Chart


ITE Grayscale Chart I(Gamma = 0.45)


EIA RESOLUTION CHART 1956

Sector Star Test Chart (72 cycles)


Sector Star Test Chart (36 cycles)


HDTV Universal Test Chart


DTV Color Rendition Test Chart


36-Patch Dynamic Range Test Chart


Spectrometer OHSP-350

OHSP350A Light Spectrometer

HPL-200 Flicker illuminometer


(C) Copyright reserved © QQ:461750718 Tel:+86-755-29983363