|
|
|
|
|
|
|
|
|
|
|
|
|
|
|
36-Patch Dynamic Range Test Chart 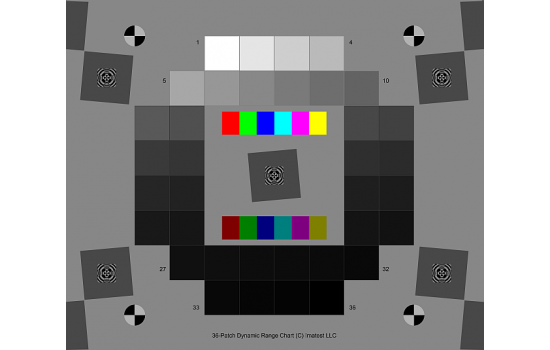 This 36-Patch Dynamic Range Test Chart has 36 low-noise density patches with density steps of approximately 0.1, for a density range of at least 3.2 (density from base to base + 3.1 minimum). A nearly circular patch arrangement ensures that vignetting has minimal effect on results. A CSV reference file with actual densities will be supplied. The chart has an active area of 197x235 mm (7.75x9.25 inches) on 203x254 mm (8x10 inch) film. It also contains slanted edges in the center and corners with 4:1 contrast for measuring MTF. The edges have an MTF50 >= 16 cycles/mm, which is about 3 times better than the best inkjet charts. Registration marks make the regions easy to select. A neutral gray background helps ensure that the chart will be well-exposed in auto exposure cameras (compared to charts with black backgrounds, which are sometimes strongly overexposed). It is supported by Stepchart, Multicharts, Multitest and can be used with the Dynamic Range postprocessor if several manual exposures are available. Dmax >= 3.4 is sufficient for camera phones and digital cameras with small pixel sizes, but high-end DSLRs generally have higher dynamic ranges (and also manual exposure), which makes them well suited for Dynamic Range. This chart is produced with a high-precision LVT film recording process for the best possible density range, low noise, and fine detail. Color Rendition Chart (X-Rite ColorChecker) Scan Reference Chart Universal Test Target Critical Flesh Tones Test Chart Bar Test Chart(IEC 61146) White Balacing Test Chart ISO 12233:2014 Edge SFR(eSFR)Test chart Color Spilled Coins (Dead Leaves) Test Chart Gray Scale Test Chart(11 steps) Streaking Measurement Test Chart Color Bar Test Chart Gray scale chart Grid Test Chart ISO 12233 Enhanced digital camera resolution chart Standard SFRplus Chart SFRplus Chart on Photographic Paper QI-SFR10-P-RM ITE Grayscale Chart II(Gamma = 1) Black & White Spilled Coins (Dead Leaves) Test Chart OECF Test Chart (ISO 14524) ISO 12233: 2014 (eSFR)Photographic chart ISO-14524 digital camera contrast chart ISO-15739 digital camera noise test chart ISO 12233 Digital still-camera resolution chart Automotive Test Chart SFRplus Chart: Inkjet on Paper - 4:1 Contrast Ratio SFRplus Chart: Inkjet on Paper - 10:1 & 2:1 Contrast Ratio Distortion Grid Test Chart HDTV Gray Scale Test Chart ITE Grayscale Chart I(Gamma = 0.45) EIA RESOLUTION CHART 1956 Sector Star Test Chart (72 cycles) Sector Star Test Chart (36 cycles) HDTV Universal Test Chart DTV Color Rendition Test Chart 36-Patch Dynamic Range Test Chart Spectrometer OHSP-350 OHSP350A Light Spectrometer HPL-200 Flicker illuminometer |
(C) Copyright reserved
©
QQ:461750718
Tel:+86-755-29983363
