|
|
|
|
|
|
|
|
|
|
|
|
|
|
|
11-Steps Gray Scale Test Chart 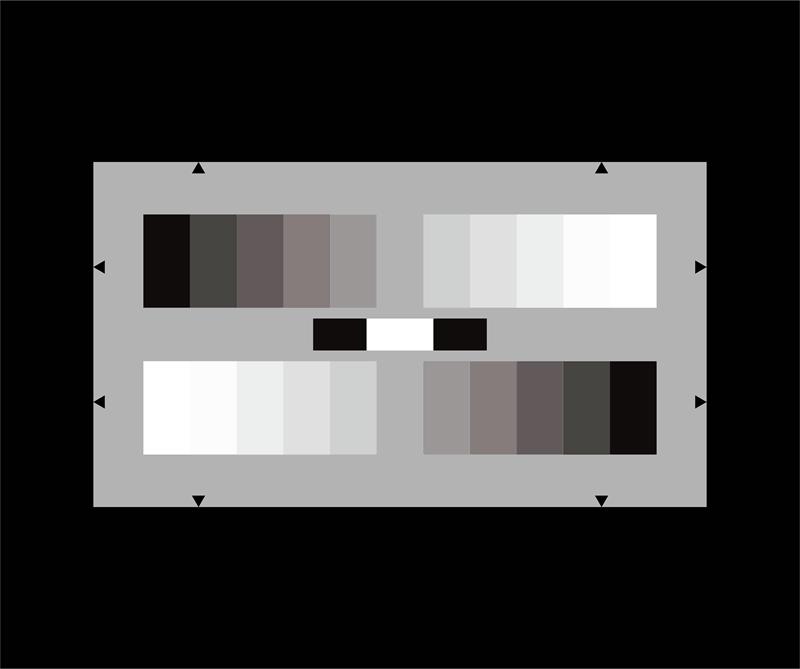 The 11-Steps Gray Scale Test Chart is disigned and used to evaluate the halftone reproduction of 16:9 electronic cameras. Two 11-graduated counter current gray scales are arranged on a gray background (D ≈ 0.56), the gray scale corresponds to the ITU recommendation BT.709. The output signal of an optimally gamma-corrected camera according to BT.709 generates two counter current, linear step signals. The contrast range of the gray scale is 40 : 1. The values of the 11-graduated gray scale are as follows:
*The production process for reflective charts allow a maximum printed density of 1.64. The target value for the darkest step is 1.70. Therefore the distance of the last step differ slightly. Two
black fields and a white field are located between the gray scales. The
density of the black fields in the middle is D > 3 (remission
<
0.1 %), the white field between has a density of 0.05 (remission 89.9%). Adjust the aperture until the lightest patch reaches 100% video signal at the waveform monitor. With an optimally corrected camera according to ITU recommendation BT.709 the darkest patch will reach 10% signal level. 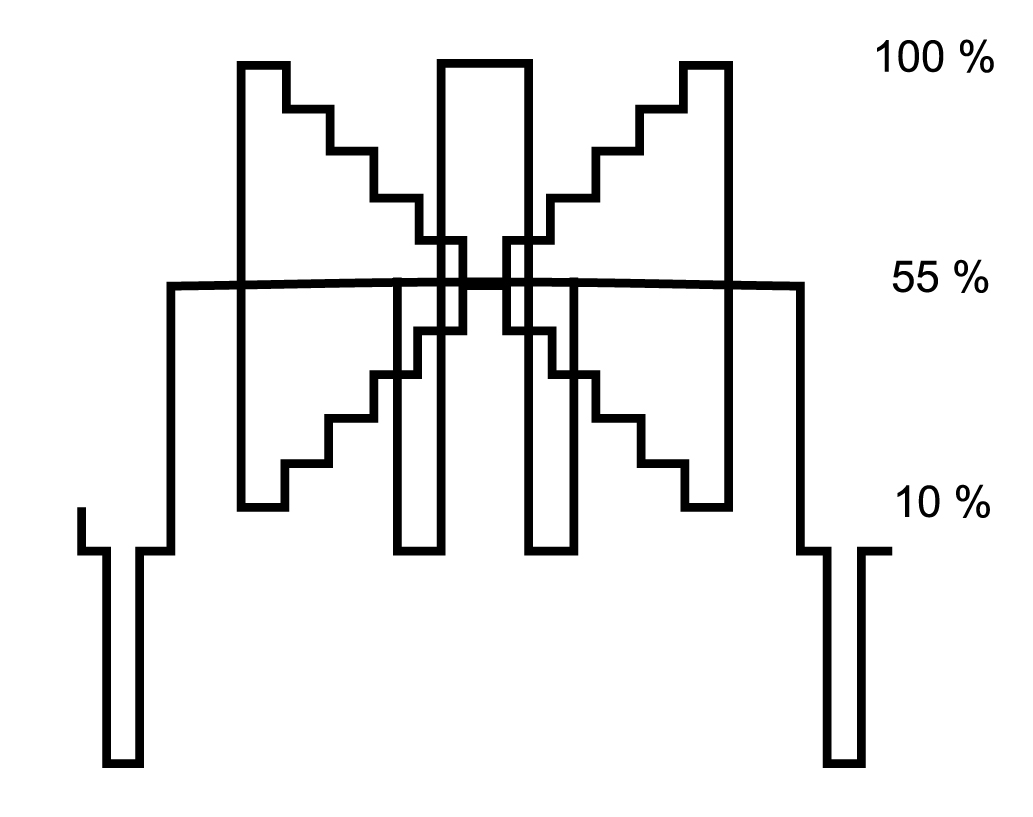 When using this chart with a gamma correction of 0.45 the video signal level for each step will change as listed in the table above. Color Rendition Chart (X-Rite ColorChecker) Scan Reference Chart Universal Test Target Critical Flesh Tones Test Chart Bar Test Chart(IEC 61146) White Balacing Test Chart ISO 12233:2014 Edge SFR(eSFR)Test chart Color Spilled Coins (Dead Leaves) Test Chart Gray Scale Test Chart(11 steps) Streaking Measurement Test Chart Color Bar Test Chart Gray scale chart Grid Test Chart ISO 12233 Enhanced digital camera resolution chart Standard SFRplus Chart SFRplus Chart on Photographic Paper QI-SFR10-P-RM ITE Grayscale Chart II(Gamma = 1) Black & White Spilled Coins (Dead Leaves) Test Chart OECF Test Chart (ISO 14524) ISO 12233: 2014 (eSFR)Photographic chart ISO-14524 digital camera contrast chart ISO-15739 digital camera noise test chart ISO 12233 Digital still-camera resolution chart Automotive Test Chart SFRplus Chart: Inkjet on Paper - 4:1 Contrast Ratio SFRplus Chart: Inkjet on Paper - 10:1 & 2:1 Contrast Ratio Distortion Grid Test Chart HDTV Gray Scale Test Chart ITE Grayscale Chart I(Gamma = 0.45) EIA RESOLUTION CHART 1956 Sector Star Test Chart (72 cycles) Sector Star Test Chart (36 cycles) HDTV Universal Test Chart DTV Color Rendition Test Chart 36-Patch Dynamic Range Test Chart Spectrometer OHSP-350 OHSP350A Light Spectrometer HPL-200 Flicker illuminometer |
(C) Copyright reserved
©
QQ:461750718
Tel:+86-755-29983363
